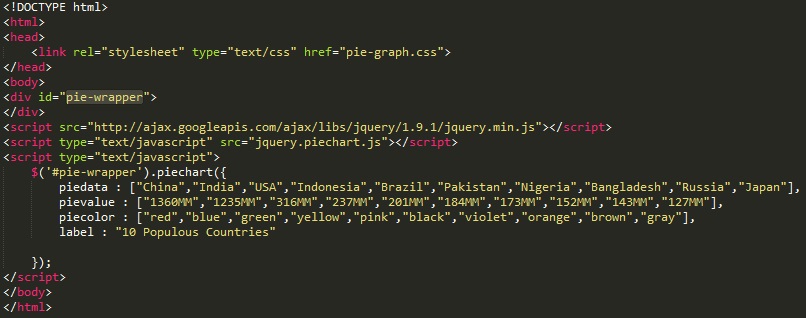
*To make piegraph*
>link css file (pie-graph.css) in head section of your html file.
>Add Div with any id in body of html.set margin(position) of div according to your pagehere it is "pie-wrapper" as it is shown in photo
>Add Google hosted Jquery File and plugin file in Body tag
>Add plugin options to div
Example is given below
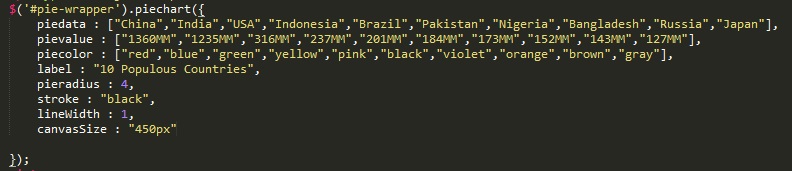
Require Plugin Options
*This options are necessary to plot graph.Table will be generated by plugin itself*
piedata:Data You can see(China,india,USA in above image).
pievalue:Data You can see (1360MM,1235MM in above image).
piecolor:color of every pie piece
label :"10 Populous Countries" as shown in image
Advanced Plugin Options
*This options are additional functionality for plugin.You can use it if you wish.*
pieradius:The more radius the less size of pie graph.default is 4
strokecolor:color of stroke line which seperate pieces.Default is black.If you want a Piegraph like second example than add colors in strokecolor instead of piecolor an dincrease the thickness with lineWidth:.Example is given below

lineWidth:Width of a stroke line.default is 1
canvasSize:size of canvas.default is 450px
Use of full functionality is seen in below pic.