*To make donutgraph*
>link css file (donut-graph.css) in head section of your html file.
>Add Div with any id in body of html.set margin(position) of div according to your pagehere it is "donut-wrapper"
>Add Google hosted Jquery File and plugin file in Body tag
>Add plugin options to div
Require Plugin Options
*This options are necessary to plot graph.Table will be generated by plugin itself*
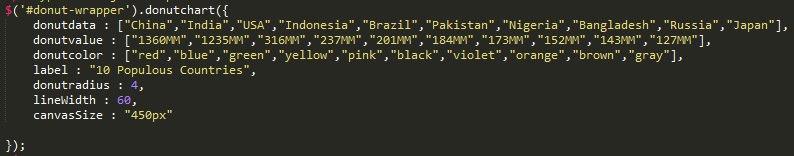
donutdata:Data You can see(China,india,USA in above image).
donutvalue:Data You can see (1360MM,1235MM in above image).
donutcolor:color of every donut piece
label :"10 Populous Countries" as shown in image
Advanced Plugin Options
*This options are additional functionality for plugin.You can use it if you wish.*
donutradius:The more radius the less size of pie graph.default is 4
lineWidth:Width of a stroke line.default is 60
canvasSize:size of canvas.default is 450px
Use of full functionality is seen in below pic.