Admin Extension

Warning!This page is part of the admin extension and is NOTincluded on Porto - Responsive HTML5 Template, to get all features, purchase both templates: Porto ($16)+ Porto Admin ($24): $41 Total.
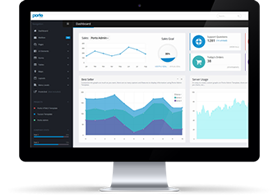
View Porto Admin!

Flot Charts

Flot is a pure JavaScript plotting library for jQuery, with a focus on simple usage, attractive looks and interactive features.

Basic Chart

You don't have to do much to get an attractive plot. Create a placeholder, make sure it has dimensions (so Flot knows at what size to draw the plot), then call the plot function with your data.

Real-Time Chart

You can update a chart periodically to get a real-time effect by using a timer to insert the new data in the plot and redraw it.

Bars Chart

With the categories plugin you can plot categories/textual data easily.

Pie Chart

Default Pie Chart

Morris Charts

Good-looking charts shouldn't be difficult.

Line Chart

A style of chart that is created by connecting a series of data points together with a line.

Donut Chart

Donut Chart are functionally identical to pie charts.

Bar Chart

A bar chart is a way of summarizing a set of categorical data.

Stacked Chart

Stacked Bar Chart.

Area Chart

An area chart or area graph displays graphically quantitive data.

Circular Charts

Easy pie chart is a jQuery plugin that uses the canvas element to render simple pie charts for single values.

Easy Pie Chart

Lightweight jQuery plugin to render and animate nice pie charts with the HTML5 canvas element.

Design
HTML

Gauge Charts

Animated Gauge Charts

Gauge

100% native and cool looking animated JavaScript/CoffeScript gauge.

Design
HTML

Liquid Charts

Adds animated liquid charts.

Liquid Meter

Exclusive Plug-in by Okler Themes

Small Inline Charts

Adds tiny charts called sparklines.

Sparklines

This jQuery plugin generates sparklines (small inline charts).

1567.89
5000
1567.89
1567.89
1567.89
1567.89

Chartist - Simple Responsive Charts

You may think that this is just yet an other charting library. But Chartist.js is the product of a community that was disappointed about the abilities provided by other charting libraries. Of course there are hundreds of other great charting libraries but after using them there were always tweaks you would have wished for that were not included.

Line Chart: Simple Chart

Line Chart: Scatter Diagram With Responsive Settings

Line Chart: With Tooltips

Line Chart: With Area

Line Chart: Bi-Polar Chart With Area Only

Line Chart: Using Events to Replace Graphics

Line Chart: Interpolation / Smoothing

Bar Chart: Bi-Polar Chart

Bar Chart: Overlapping On Mobile

Bar Chart: Add Peak Circles Using Draw Events

Bar Chart: Multi-Line Labels

Bar Chart: Stacked Chart

Bar Chart: Horizontal Chart

Bar Chart: Extreme Responsive Configuration

Pie Chart: Simple Chart

Pie Chart: With Custom Labels

Gauge Chart

CSS Animation